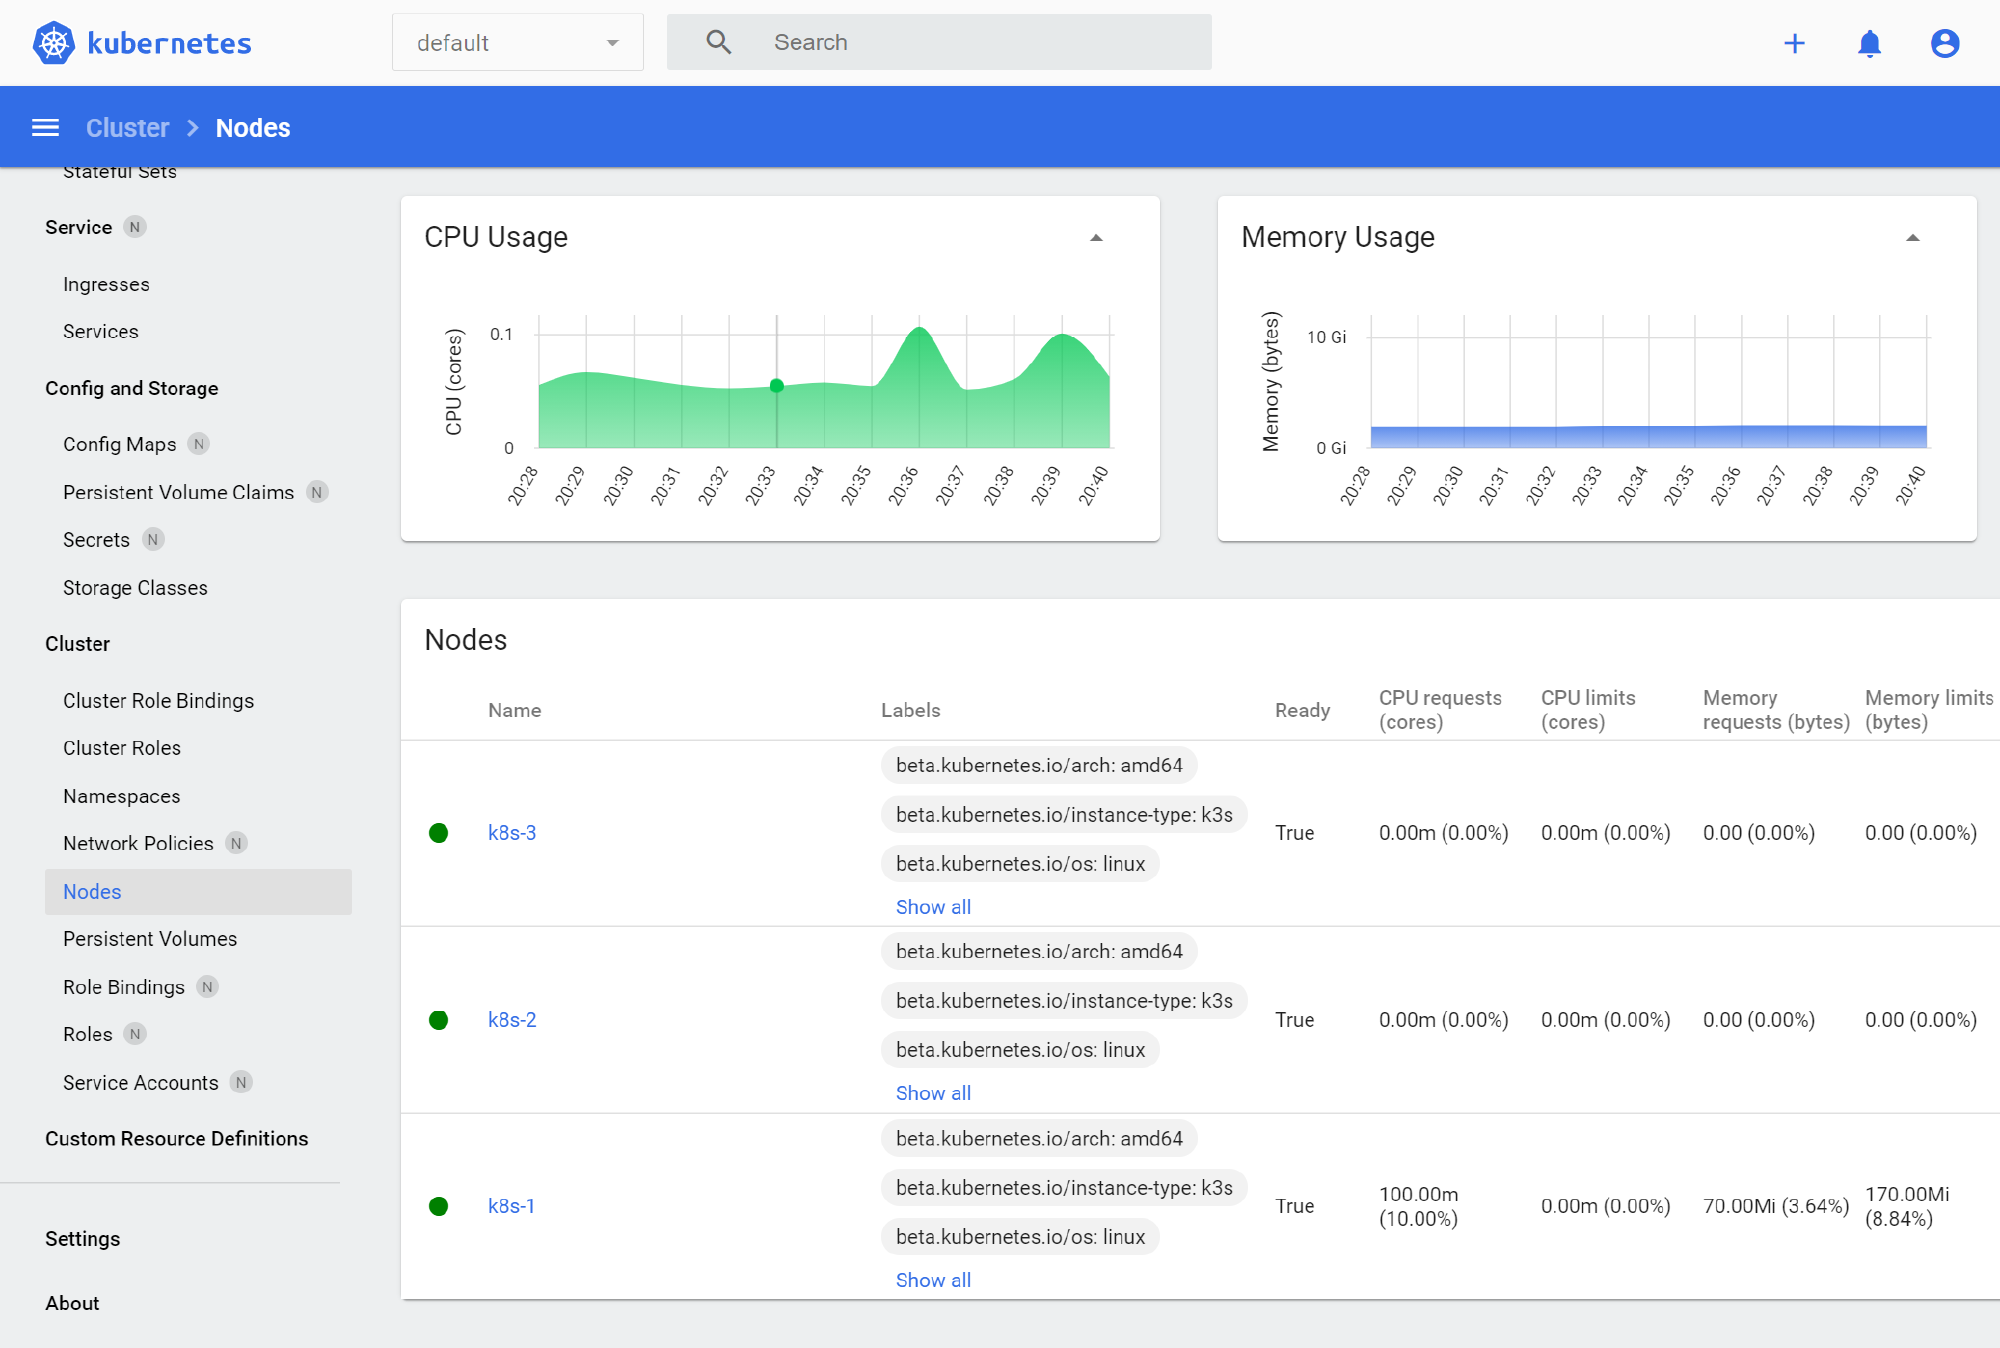
While I don’t find the dashboard very useful for configuring anything in the cluster, it can be helpful to find a resource you’ve lost track of or discover resources you didn’t know were there.
Before following this guide, you should have an installed kubernetes cluster. If you don’t, check out the guide how to Install K3s.
Installing the dashboard
To install the dashboard we need to run the following one command on the primary cluster node (in my example, this is k8s-1). K3s installations require the command be prefixed with sudo:
-
- K3s:
1sudo kubectl apply -f https://raw.githubusercontent.com/kubernetes/dashboard/v2.3.1/aio/deploy/recommended.yaml
- K3s:
This URL includes the version number, so you will want to double check that it is up-to-date when following the instruction. The latest version will show up at the K8s dashboard latest release page.

Creating the admin user
Accessing the dashboard requires that we supply a token to authorise ourselves. This account is not created by the command above.
-
On the primary cluster node create a file called
dashboard.admin-user.ymlwith the following content:1 2 3 4 5apiVersion: v1 kind: ServiceAccount metadata: name: admin-user namespace: kubernetes-dashboardI recommend using
nanoto create the file:1nano -w dashboard.admin-user.ymlTo save the file and exit
nanoonce you’ve copied the contents into the terminal type ctrl+x followed by y to confirm that you want to save the file and finally enter.When applied to the cluster this will create our user account called
admin-userand store it into thekubernetes-dashboardnamespace, which was created by the installation step above.- The
apiVersionmust be set tov1so that K8s knows which fields are acceptible. - The
kindmust be set toServiceAccountto tell K8s that we’re attempting to create a user.
- The
-
Also on the primary cluster node create another file called
dashboard.admin-user-role.ymlwith the following content:1 2 3 4 5 6 7 8 9 10 11 12apiVersion: rbac.authorization.k8s.io/v1 kind: ClusterRoleBinding metadata: name: admin-user roleRef: apiGroup: rbac.authorization.k8s.io kind: ClusterRole name: cluster-admin subjects: - kind: ServiceAccount name: admin-user namespace: kubernetes-dashboardWhen applied to the cluster this will create a “role binding” to bind our user account to the cluster admin role.
- The
apiVersionmust be set torbac.authorization.k8s.io/v1to tell K8s that we’re using the RBAC API version 1. A differentapiVersionwill likely change the fields available for use below, so will break our attempt to apply to the cluster. - The
kindfield must be set toClusterRoleBindingto tell K8s that we’re attempting to create a Cluster Role Binding that binds an account to a cluster role. - The
metadata.nameentry is an arbitrary name for the role binding but it makes sense to name this the same as the user account that we’re binding. subjectslist must include one or more items. Each item in the list must have akind,name, andnamespacefield.- The
kindfield must be set toServiceAccountsince that is what we used to create ouradmin-user. - The
nameshould be set to the same as that we used in thedashboard.admin-user.ymlfile, i.e.admin-user. - The
namespaceshould be set to the same name as that we used in thedashboard-admin-user.ymlfile so that K8s can find the correct service account, i.e.kubernetes-dashboard.
- The
- The
roleRefconfiguration specifies the role that each user in thesubjectslist is assigned to.- The
apiGroupfield must be set torbac.authorization.k8s.ioto tell K8s that we’re referencing a role-based access control role. - The
kindfield should be set to that of the accounts in thesubjectslist are granted the role ofcluster-admin- This is a default role in K8s.
- The
- The
-
Apply these configurations to the cluster with the following command:
- K3s:
1sudo kubectl create -f dashboard.admin-user.yml -f dashboard.admin-user-role.yml
- K3s:
Accessing the dashboard
Accessing the dashboard is tricky because you need to both access over HTTPS, or via localhost (i.e. from the same machine). You also need to get a token to authorise your access with. I will show how to access remotely over HTTPS (do not do this if your cluster is on a public network!):
-
On the primary cluster node edit the
kubernetes-dashboardservice:- K3s
1sudo env EDITOR=nano kubectl edit service kubernetes-dashboard -n kubernetes-dashboard
-
Move the cursor down to the line that includes
type: ClusterIPand change it totype: NodePortwith the same indentation. (This is the configuration path.spec.type) -
Save and exit the editor with ctrl+x followed by y to indicate that we want to save the file and finally enter to confirm.
- K3s
-
On the primary cluster node run the following to determine the port number to connect to the Web UI:
1sudo kubectl get service kubernetes-dashboard -n kubernetes-dashboardIn my installation this prints:
1
2
NAME TYPE CLUSTER-IP EXTERNAL-IP PORT(S) AGE kubernetes-dashboard NodePort 10.43.128.69 <none> 443:31235/TCP 126mThe important part is the
PORTcolumn which has the value443:31235here. The second number, after the colon (here it is31235), is the port we will use to connect. The hostname is the primary node address. In my case this will mean an address ofhttps://k8s-1:31235/. Load this address in your web browser and accept the warning about a self-signed security certificate to load the UI. -
On the primary cluster node run the following to get your token:
- K3s:
1echo $(sudo kubectl -n kubernetes-dashboard get secret $(sudo kubectl -n kubernetes-dashboard get sa/admin-user -o jsonpath="{.secrets[0].name}") -o go-template="{{.data.token | base64decode}}")
Copy and paste the output into the field on the Web UI login screen.
- K3s:
You should now be able to navigate to the nodes item in the left-hand menu of the UI to see your nodes:
